
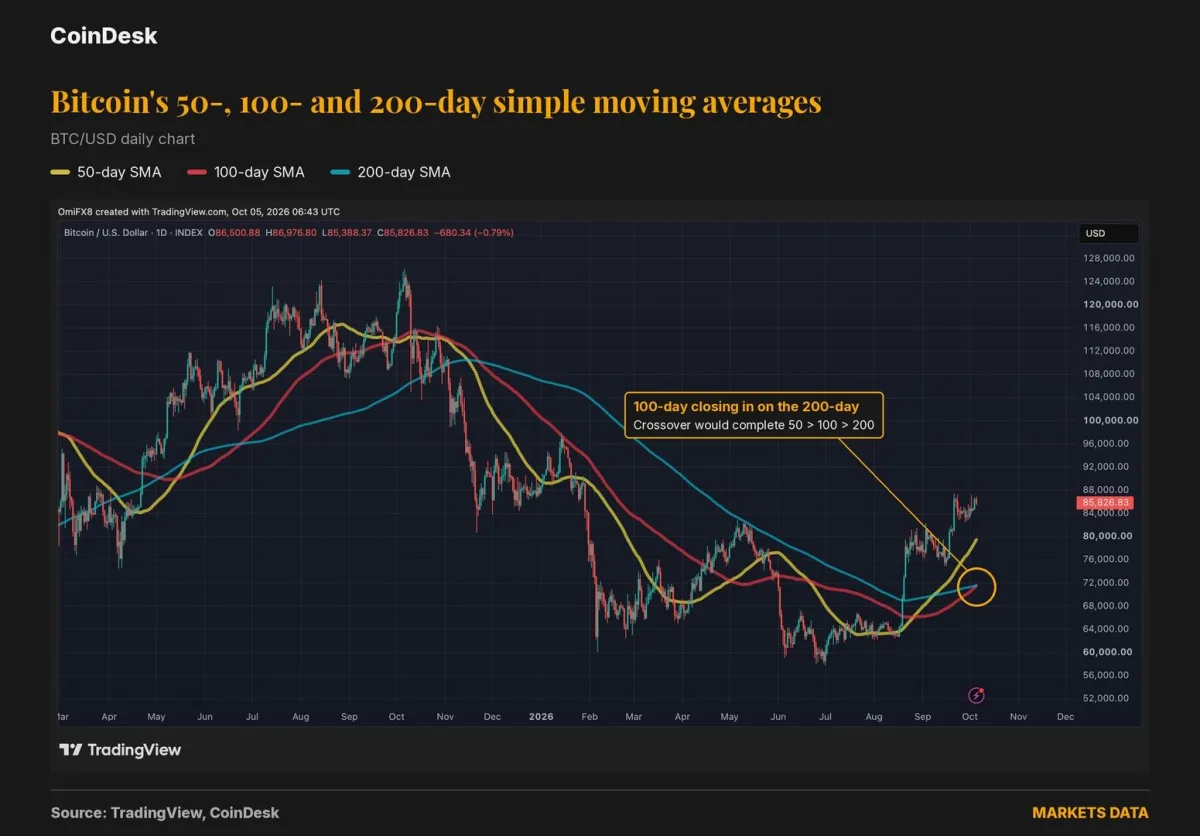
A new threshold in the technical picture
The technical setup being tracked in the Bitcoin market suggests that a strong bullish signal unseen for more than a year could be forming again. That possible signal is being interpreted as a sign that the price recovery seen over the past three months may be more than just a temporary move.
The cryptocurrency gained more than 40% in the third quarter, rising to the $87,000 level. But in recent days, the rally has slowed around $85,000 alongside the continued rise in the U.S. Dollar Index.
Subburaj said the latest signal confirms that the recovery is holding up.
How have similar signals affected price in the past?
Previous technical alignments have not always produced the same outcome. In some periods, the pattern marked the start of a strong rally, while in others it proved short-lived or had only a limited impact on price.
- A similar setup that formed on Oct. 27, 2020 held through May 2021. During that period, Bitcoin rose from about $13,600 to above the then-record $64,000.
- A setup confirmed in early November 2023 also remained valid through May 2024. In that stretch, the price climbed from around $35,000 to $73,000, more than doubling.
- Another bullish alignment seen in June 2025 lasted 97 days. Even so, the price rose from roughly $106,000 to $112,000, a more modest increase.
- A similar structure in June 2024 lasted just 20 days, and Bitcoin fell by around 10%.
What level is being watched now?
According to analysts, the real test for the new technical signal will be whether the spot price can remain above the 50-day moving average. This level stands out as a key threshold for judging the strength of the uptrend, especially during a possible correction.
Bitcoin holding above this average could help reinforce the market’s view that the rebound of the past three months is on firmer ground. On the other hand, a move below that level could raise questions about the durability of the latest rally.
"""




Comments (0)
No comments yet. Be the first to comment.
Write a Comment
Yorum yazmak için giriş yapın. Üyelik ücretsiz; yorumunuz editör onayından sonra yayımlanır.